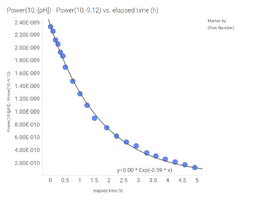
The curves I fit on the data seem quite good, although they are not perfect. The k parameter should describe the ability of the tank to exchange gases, the higher the value, the faster the gas exchange should be. It should correspond to the diffusion capacity constant in this equation:
J = k * Δp
where J is the amount or concentration of the gas,
k is the diffusion capacity,
Δp is the driving force, partial pressure difference, or CO2 concentration in water minus the CO2 equilibrium concentration.
k should depend only on the aquarium properties, that is, how well the water surface is agitated, how big the surface is, etc ... This should be the same, no matter how big or small the Δp is.
If I take my three bucket experiments and recalculate this value multiple times so that I always leave out x number of measurements from the start (as if I started the experiment with lower CO2 levels), this is what I get:
In the first experiment, the bucket is inside the house, with no fan over the bucket:


We get a seemingly good curve fit on the left side, but there are a few dots above the curve. On the right side, the k is shown as a function of the CO2 gradient (CO2 in water - CO2 equilibrium) at the start of the curves at each iteration. The k is shown in relative values compared to the first value. That means we will get slightly different values depending on the time and CO2 levels at which we start calculating the k values. So different k applies to different concentrations, although it should be constant.
My assumption for this anomaly is the following:

On the left side is the assumption for our exponential equation; that is, the partial pressure in the air is even and constant, so the pressure difference is a linear function of the water CO2 level. On the right side, we have higher CO2 levels in the air near the water surface because CO2 diffuses out of the water. The above-water CO2 level depends on the water level, the CO2 diffusion in the air, and the air movement above the water. This CO2 level difference compared to the left side drawing could be negligible, though, since the CO2 amount in the water is negligible compared to the air, and there could be a fast diffusion in the air anyways. But if not, that should affect the dynamics, and we should not get a perfect curve fit and stable k values.
So I did the experiment with the fan to refresh the air above the water continuously and to keep the air CO2 levels stable, in the hope that I get a better curve fit:
The bucket inside the house, with a fan over the bucket


On the left, the curve fit looks only a little bit better than previously. But, if we look at the k-value stability on the right side, they seem stable down to CO2 differences of about 2 ppm. Most likely, the pH measurement accuracy is not good enough at these pH differences to measure these small differences (check the variability of dots 6. - 8. on the left plot around the line, these are near the start of the curve used for k determination for the last two points on the right plot).
Finally, the same plot for the on-the-porch experiment:


Now we have the same points-over-the-curve pattern on the left side as in the first plot above. The k values sink as the CO2 level gets smaller, and the correlation is even steeper than the first time. I guess the lower air CO2 is affected relatively more by the CO2 diffused out of the water as the higher air CO2 levels.
I plan two more experiments to clarify this k anomaly. I'll repeat the porch experiment with two modifications:
1. with a fan: it should rectify the k value across different CO2 levels
2. with a lid over the bucket; this should make the k plot steeper. I might need to place the lid close to the water level to increase the effect.


